Purpose
Analyze survey data and presnt findings to the decision makers to key decision makers.
Context
During a brainstorming workshop on decision-making during the first 72 hours of a sudden-onset emergency held at last year’s Humanitarian Networks and Partnership Week (February 2015), participants identified three key decision points:
- DP1 - Notification and decision on whether the event requires follow-up?
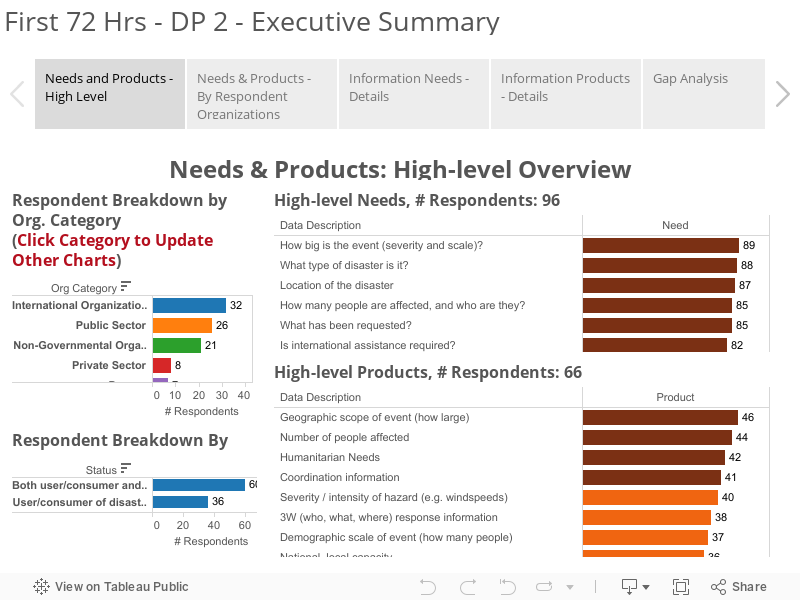
- DP2 - Should we deploy assets or activate our systems?
- DP3 - What are the initial deployment priorities?
The survey was designed to investigate and match information requirements and services at each of the three decision points. Going further into detail it also tries to capture the underpinning datasets at each of these decision points. To capture this in a systematic way data requirements were broken down into four broad categories (followed by more detailed sub-categories):
- Crisis Scope & Scale
- Humanitarian Access
- Humanitarian Needs
- Capacity & Response
These categories are derived from the MIRA Analytical Framework (multi-sectoral initial rapid assessment) developed by the former Inter-agency Standing Committee’s (IASC) Needs Assessment Task Force (NATF). The analytical framework can be found in the MIRA guidance1 on page 4.
Note: Due to time limits and resource constraints, DP2 was given higher priority by the client and is analyzed in meantime and other decision points are postponed for now.
This project is sponsored by Digital Humanitarian Network (DHN). A group of Statistics Without Borders volunteers have collaborated on this project and the results (other versions of the visualization) has been presented at the 72hr Task Force workshop at the Humanitarian Networks and Partnerships meeting (February 2016) to a diverse audience - from UN, national governments, and Search and Rescue teams, to Red Cross/Crescent, National and International NGOs!
Challenges
Data Structure and Format
-
The downloaded data referenced option values from the survey, where actual options was not clear. I had to go back to the survey HTML source code and capture actual options in a separate Excel tab.
-
The survey data was available as wide data with variables for every survey question. I used
dplyrandtidyrpackages to keep demographic variables intact and turn other variables into long format. -
After turning data into long format, number of the records was not number of respondents anymore. Used
COUNTD()and a unique identifier to calculate number of respondents to any given question or group of questions.
Survey Design
-
The respondents are either User of information, Provider of information, or Both. Giving the option of selecting Both and asking the same set of questions with a different variable name, made our job unnecessarily complex.
-
The survey is designed as a hierarchy of asking follow-up questions depending on the previous responses. The variable names are packed with information about the type of respondents and their previous responses. We had to use various calculated fields to extract information from variable name.
-
The respondents are asked if they need or provide a specific piece of information. They are given Yes and No options, where they also could leave the question unanswered. We decided to interpret unanswered as No, but the issue could be eliminated during survey design.
-
We had 2 different meanings for Null values. Either the respondent has not seen that question, or decided to leave it blank. To calculate proportion of respondents who answered Yes to a particular question, I defined Asked calculated field to be used as the denominator in the proportion calculation.
Tableau
Bonus Tip: If you have more than 1 dimension in a bar chart listed on the same (row or column) shelf and you would like to sort each group based on the last dimension in ascending or decending order, it can be really challenging to get what you look for.
Solution:
- Create a combined field with all the dimensions involved in the chart’s row or column.
- Using
Edit combined field, make sure the fields are listed in the desired order. - Put the newly-created combined field right before the last dimension.
- Clear all the sorts and sort the combined field the way you like.
- Remove
Show headercheckbox on the combined field.
Visualization
Links
- Project Repository: First 72 Hours Data Cleaning, Analysis, and Visualization
- Data Visualization: First 72 Hours DP2 Executive Summary